Developer tools for designers
Programming - Apr 19, 2024
As a front-end designer, I spend a lot of my time working in a browser with the developer tools open. This magical panel of tools provides some features that make my design workflows faster and more fun, but they can be easy to miss. Therefore, in the spirit of sharing, I thought I’d compile a list of some of my favorites!

In this post I will be focusing my attention on the developer tools in the browsers I use most, Firefox and Chrome. Unless otherwise noted, these tips will work in both browsers.
Toggle CSS classes
While testing designs in a browser, I used to manually edit the markup in the inspector, often adding ZZZ to the end of a class name that I wanted to disable — because I wanted to put them to “sleep”. 😴
Sometimes I would end up deleting a class name from the markup, which made it even more troublesome to revert to its previous state.
<div class="HashHeadingZZZ HashHeading--h2"></div>
Code language: HTML, XML (xml)
Thankfully, there is a better way!
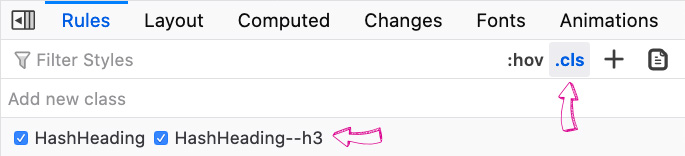
Once a DOM element is selected in the inspector, you can save yourself a few extra clicks by toggling existing classes in the .cls pane under the rules tab in Firefox and the styles tab in Chrome.
Adding CSS classes
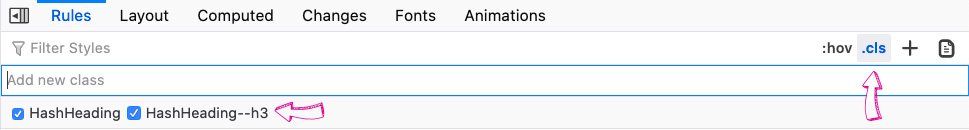
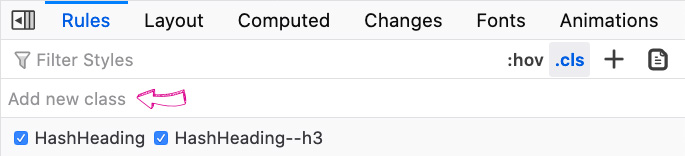
Similarly, I would often find myself adding new class names to elements in the DOM by editing the markup in the inspector. A faster and more reliable method makes use of the “add new class” input. Within the same .cls pane, an input exists that allows you to add classes to the currently selected element. New class names will appear in the list of active classes to toggle from the previous example.
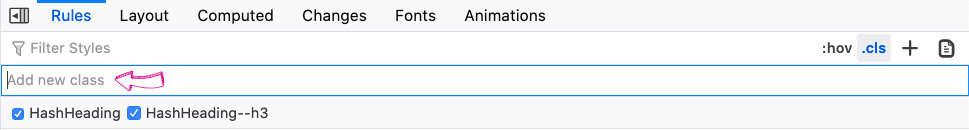
Chrome DevTools, offers a bit of additional “sugar” by offering auto suggestions when entering class names into the add new class input. This is especially handy when you can’t remember the available class names at your disposal.
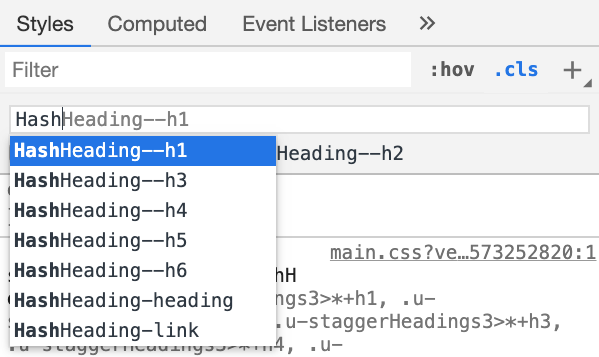
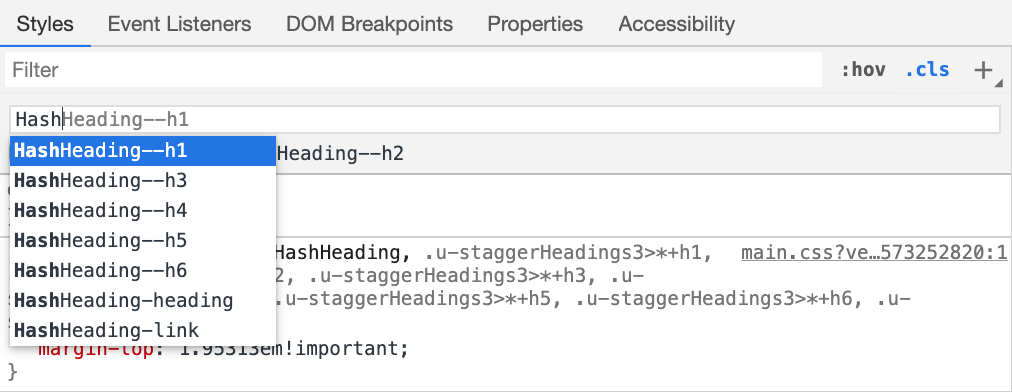
I find this incredibly helpful when working with prefixed classes, such as utility classes starting with u- for example. Start typing u- into the input and Chrome will provide a list of all available utility classes starting with that prefix. 🎉
Toggle CSS state pseudo-classes
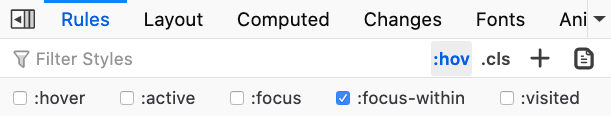
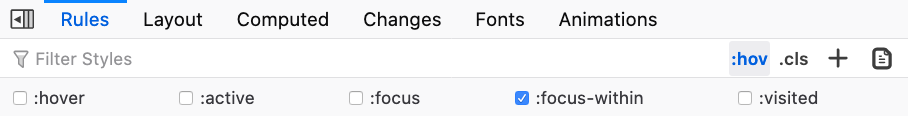
Recently, I’ve found myself using the :focus-within pseudo-class toggle quite often. This has proven to be more efficient than interacting with the “Change Pseudo Class” flyout-menu (when right-clicking on an element in the inspector). These can be found in the :hov pane under the rules tab in Firefox and the styles tab in Chrome.
Hide DOM elements
While working on a design, it can be helpful to temporarily hide an element from view in the browser. The fastest way I have discovered to achieve this is by selecting the element you’d like to hide in the inspector, and pressing the h key on your keyboard.
Poof, magic. 🎩🐰. This will apply a unique browser specific visibility: hidden; class to the selected element. This is quite different than applying display: none, which I think would be more useful IMHO, but I still make use of this feature often.
In case this tip has inspired you to investigate other keyboard shortcuts, here are links for both Firefox and Chrome developer tools.
document.designMode
It’s often useful to quickly modify text within an interface. Perhaps you want to preview how some different copy looks, need to take a comparative screenshot, or maybe you need to quickly see how a group of titles will look when one breaks onto additional lines. For this, entering document.designMode = 'on' into the console tab can come in handy.
Navigate DOM elements with arrow keys
Did you know you can traverse the DOM in DevTools with the arrow keys? I didn’t until a teammate, Paul Hebert pointed this out to me and now I use this technique everyday!
Additionally, if you want to move a currently selected element up or down in the DOM structure, (instead of dragging & dropping) you can use:
ctrl + ↑ / ctrl + ↓ on Windows and ⌘ + ↑ / ⌘ + ↓ on Mac.
Highlight all elements matching a selector
Clicking the small crosshair icon that appears to the right of any selector name in the rules tab will select all elements on the current page with the same class name.
Changes
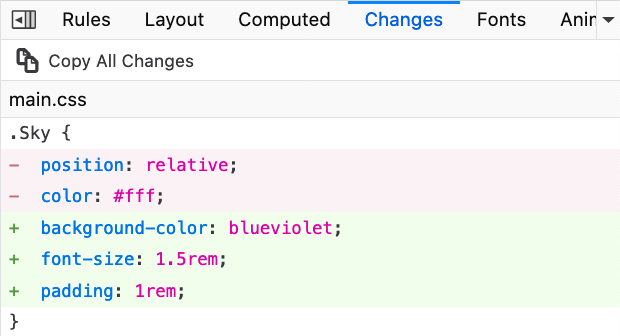
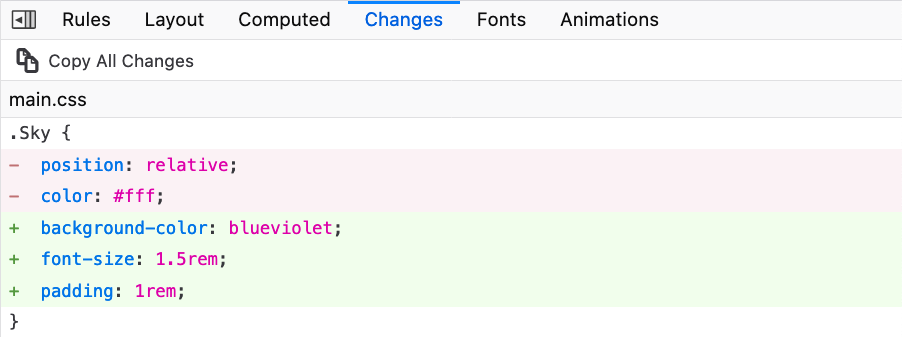
While designing in the browser, I make CSS edits directly in the rules tab all the time . Eventually, the code changes I want to keep need to find their way back to my text-editor. There are ways to save changes to a local file on your computer. However, I much prefer to use the changes tab (Firefox only). The changes tab will display all of the currently changed selectors and properties.
Selecting accessible contrast for text color
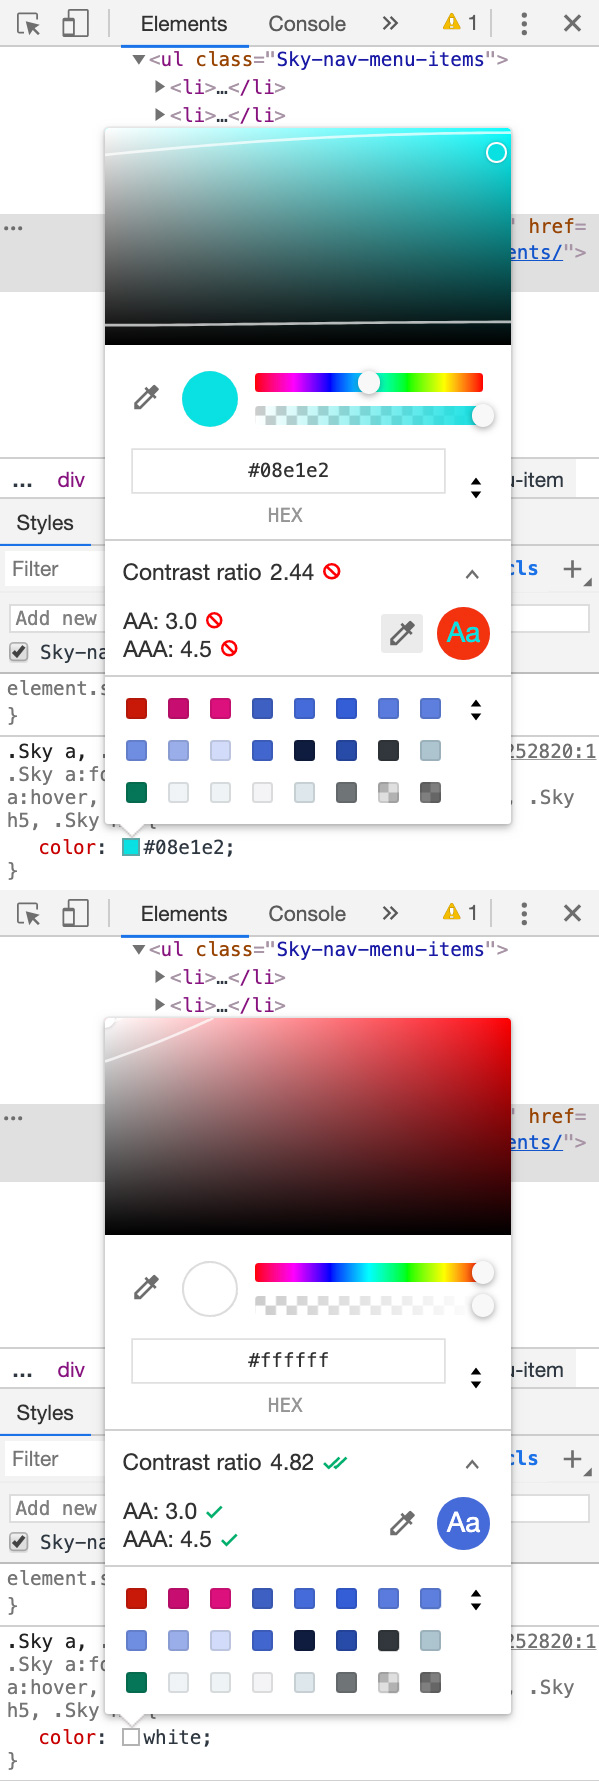
Both Firefox and Chrome include accessibility contrast indicators when selecting text colors. However, I find the Chrome DevTools implementation a bit more robust. Open a color picker for a text element (the color property, not background-color) and you will see an expandable contrast ratio section.
This interactive panel will display the contrast ratio between the text and what Chrome determines as the text’s background color. The panel will provide visual feedback in the form of 🚫 (fail), ✅ (AA pass) and ✅✅ (AAA pass) icons. Clicking each of those icons will provide more information about accessible color contrast guidelines.
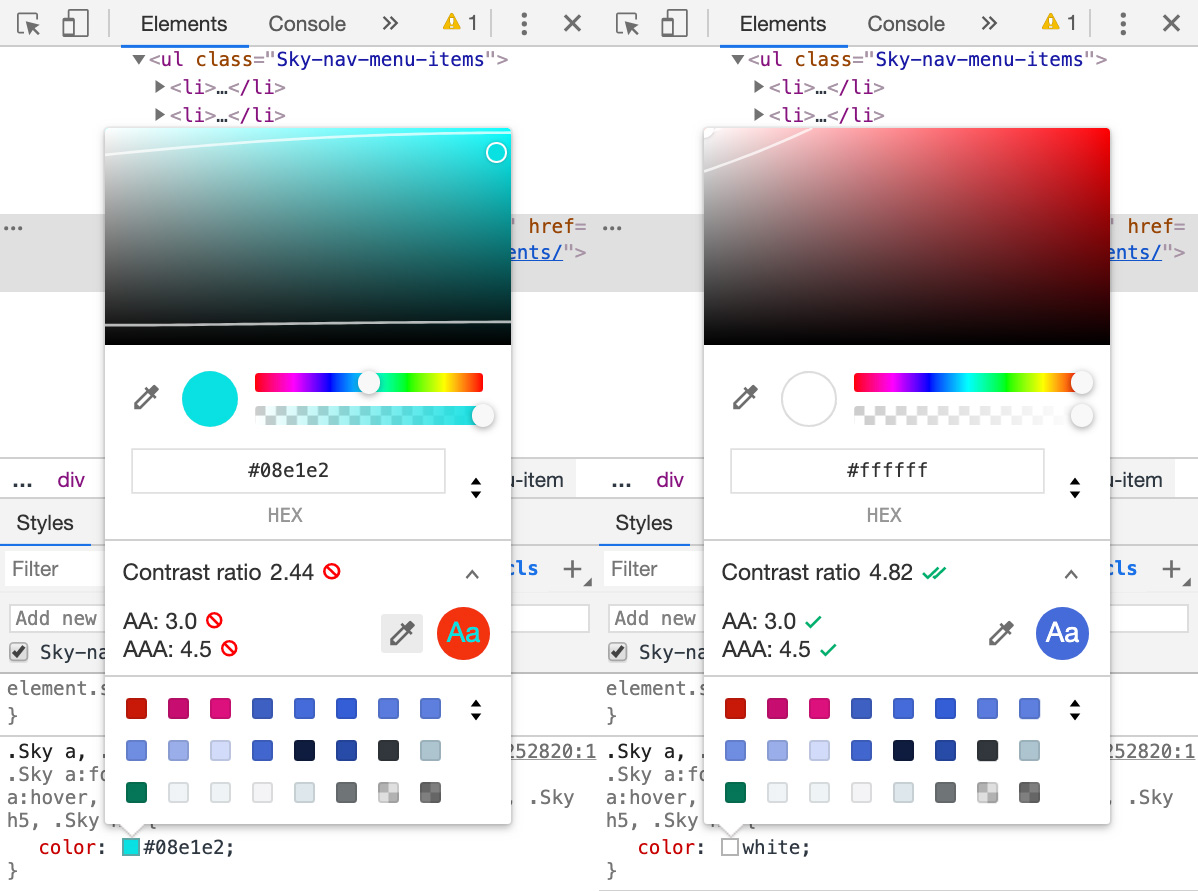
If you expand the contrast ratio section, you will see additional information with the ability to choose different background colors to compare against. Also, the color spectrum section will now display a contrast boundary line. If your background is dark, then colors above this line are AA-compliant. If the background is light, choose a color from below the boundary line. I find this contrast boundary extremely useful.
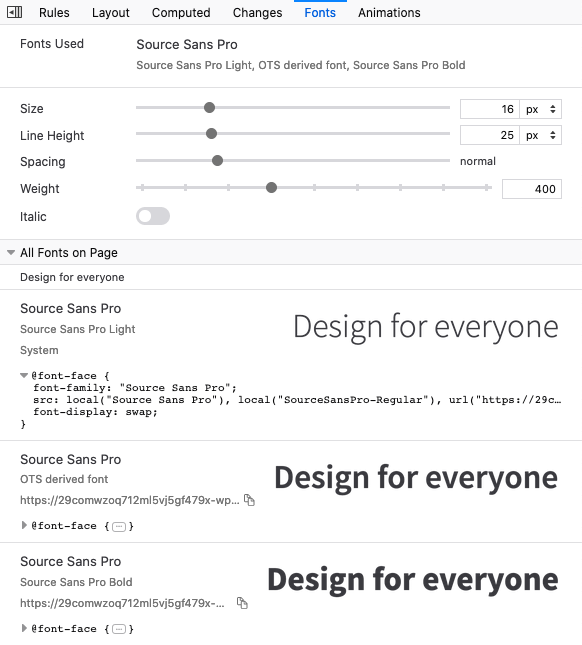
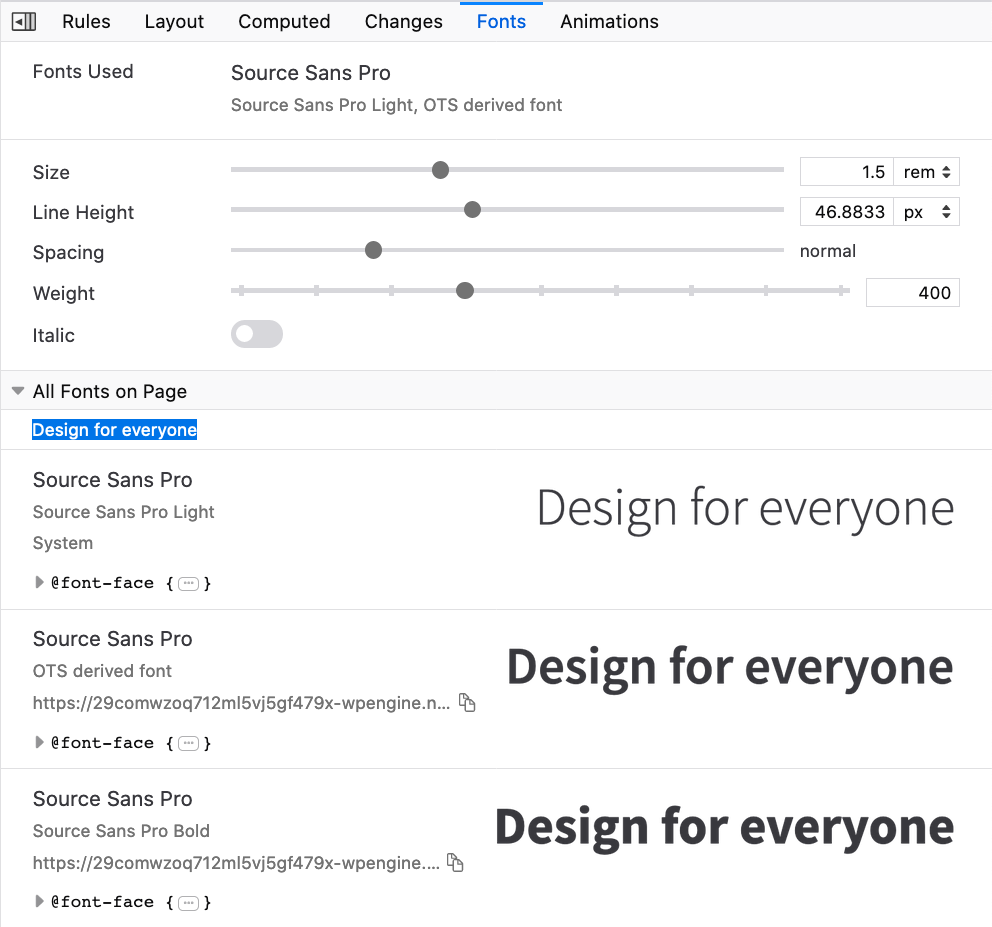
Fonts
I’ve been having a lot of fun with variable fonts lately. The fonts tab in Firefox developer tools has been a huge help. I have found the size, spacing and weight sliders to be particularity helpful and time saving.
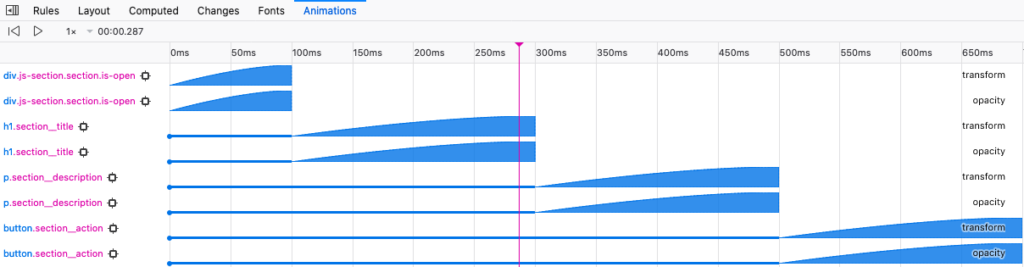
Animations
The animations tab offers a few visuals and features that I find particularly useful. For one, being able to see the timing and easing of the animation is helpful – especially for more complex animations. Furthermore, the ability to slow down the animation as well as highlight the various animated elements with the crosshair icons are very much appreciated.
Shadow editor
This Chrome DevTools shadow visualization tool has come in handy for me a lot. The interactive panel can be opened by clicking on the shadowed square symbol near your box-shadow or text-shadow property in the styles panel.
This feature works great with single box-shadows, or multiple layered box-shadows.
Grid visualizations
I thought I’d end this post with one of my favorite and most frequently used developer tool features at the moment, the grid visualizer in Firefox. Toggle the grid highlighter by clicking the grid icon next to an element in the rules panel with the display: grid; property. From here, there are several aspects of the overlay that you can customize.
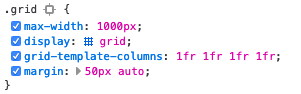
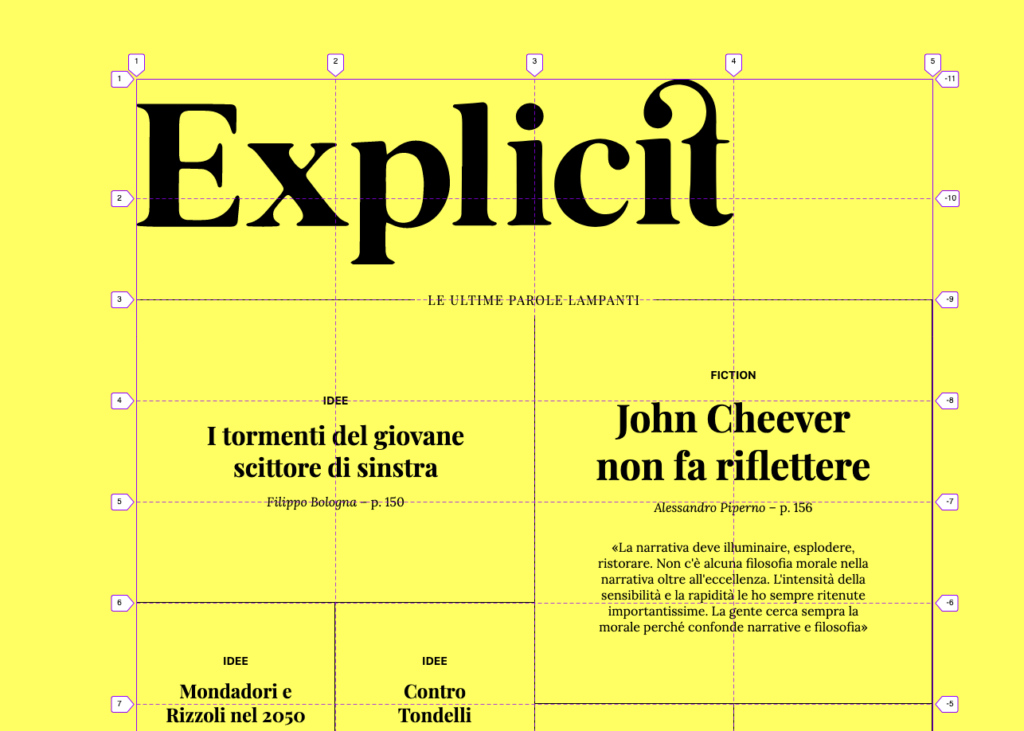
With the grid element selected a few options become available under the layout → grid panel. For example, you can toggle the display of grid line numbers.
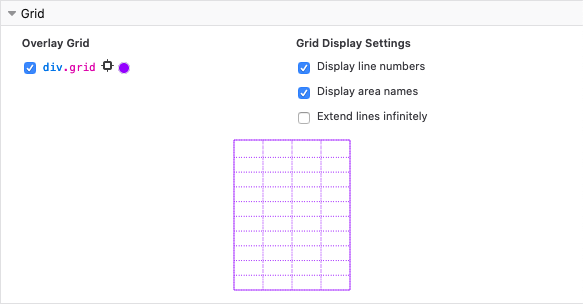
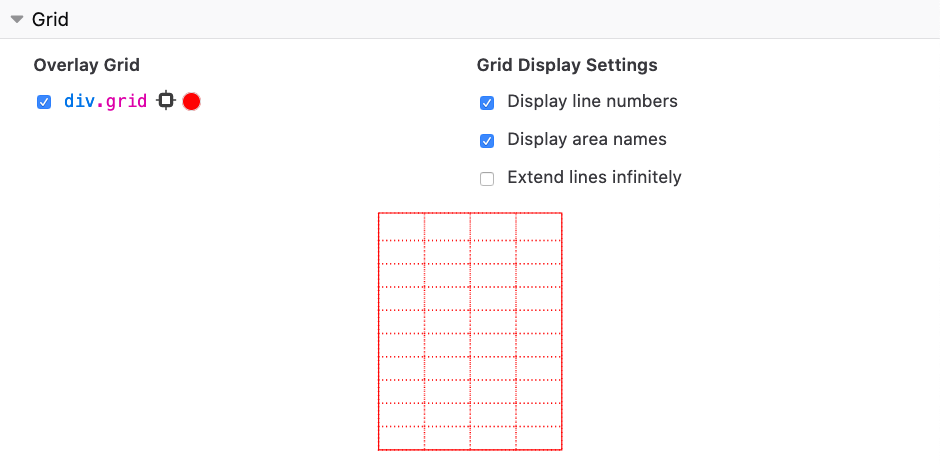
Additionally, you can control the color of the grid overlay itself. This is helpful when the contrast between the background color and overlay is low and the grid overlay is difficult to see.
If you are making use grid-template-areas, you can even toggle the display of grid-area names!
At the time of writing this, the Chrome DevTools team has announced that their CSS grid tooling is coming soon!
I’m grateful that the fine browser-making folks continue to prioritize improving their developer tools. I’m discovering new ways to improve my daily design tasks all the time. If I’ve missed a really awesome feature that you love using, let me know!
